Since Angular 9 release (2020), we can access the Ivy debugging API through the global ‘ng’ object in our browser devtools. It has been really useful for me, so I will share in this post a few things that I often use while developing.
What is ‘ng’?
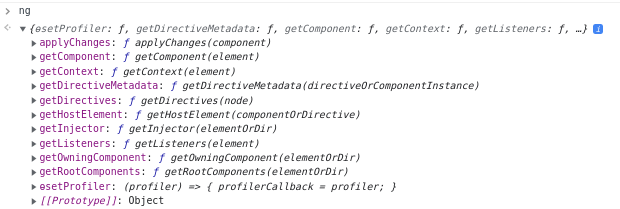
The ‘ng’ object is the Angular global instance. If you type ‘ng’ in your browser while running an Angular project, you will see something like this:
ng.getComponent(elt)
Gets the angular component instance from an HTML element. I use this one all the time to check the state of a specific component (what are the @Input() values, what are some properties values at a given time…). You can also use this on a third-party component which is really helpful (ex: highcharts, ag-grid…).
How to use it?
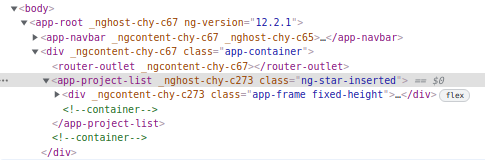
Go into the ‘Elements’ tab of your browser devtools and select the node matching with the angular component that you want to check.
Then go into the ‘Console’ tab, and type:
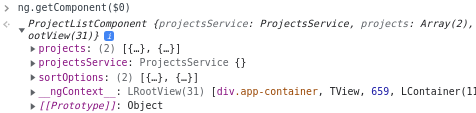
ng.getComponent($0)
What is ‘$0’ ?
$0 is the most recent selected element reference from the Elements inspector in devtools.
You will get the list of all properties and methods of this component.
You can explore the other methods of the ‘ng’ object using the same process. Here are some interesting ones:
- ng.getOwningComponent(elt): Gets the parent component for the selected HTML element, so it is just like the “ng.getComponent” but without having to select the exact component in the DOM.
- ng.getDirectives(elt): Gets the array of directives from an HTML element.
- ng.getListeners(elt): Gets an array of both HTML (ex. click, change, focus) and host listeners for an HTML element. This allows you to trigger listeners without actually doing any action.
Conclusion
You should now have a better idea of how easier it is to debug angular apps with the help of the Angular global instance in the developer console.